Open any profile dashboard and the first thing that greets you is a wall of numbers. Followers, likes, views, impressions, reach, and a dozen little graphs that all seem to be pointing somewhere. Most people glance at the follower count, feel good or bad for a second, and close the tab. That habit costs you more than you think, because the number that makes you feel something is rarely the number that tells you what to do next.
This guide walks through what your profile analytics are actually saying. We will separate the vanity from the useful, go metric by metric, look at what healthy figures look like across platforms, and finish with a simple routine you can run every week. No jargon for its own sake, and no pretending that a single magic number exists. By the end you should be able to look at your own dashboard and know, within a minute, whether things are going the way you want.
The one idea to hold onto A metric only matters if it changes a decision. If a number goes up or down and you would do exactly the same thing either way, it is entertainment, not information. Judge every stat by that test. |
Vanity Metrics and the Numbers That Pay the Bills
Vanity metrics are the ones that grow almost on their own and feel like progress without proving any. Follower count is the classic example. It rarely goes down, it looks impressive on a profile, and it has surprisingly little to do with whether your content reaches people or moves them to act. A creator with 5,000 engaged followers routinely outperforms one with 50,000 quiet ones.
Actionable metrics are different. They tell you something specific about what happened and what you should try next. When saves climb, you know the content was worth keeping. When link clicks jump, you know your call to action landed. These are the numbers worth building your week around.
The chart below scores common metrics by how much weight they deserve when you are actually deciding what to make next. Notice how the numbers everyone brags about sit at the bottom, and the quieter ones near the top.
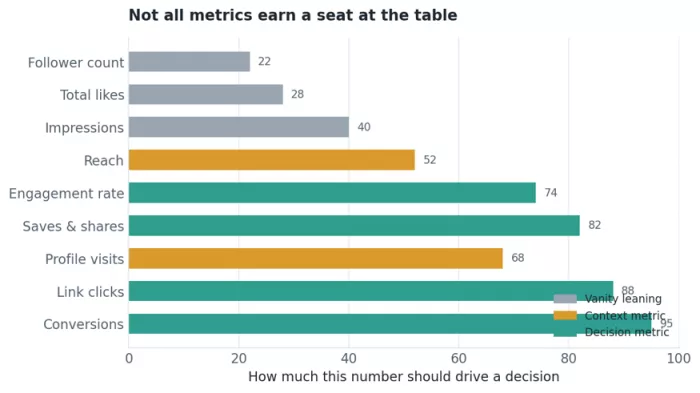
Figure 1. Where each metric belongs when the goal is a decision, not a dopamine hit.
A quick way to sort any metric
When you are not sure which bucket a number falls into, ask three short questions:
Does it move when my content quality changes? If a great post and a weak post produce nearly the same number, the metric is too blunt to guide you.
Can it connect to something I care about? Sales, sign-ups, saved posts, replies. A number with no line to a real outcome is decoration.
Would I change my plan based on it? If the honest answer is no, stop checking it daily.
The Core Metrics, One by One
Every platform uses slightly different names, but the underlying ideas repeat everywhere. Here is what each of the important ones means and, more usefully, what it is trying to tell you.
Reach and impressions
Impressions count how many times your content appeared on a screen. Reach counts how many separate people it appeared in front of. If your reach is 4,000 and your impressions are 12,000, the average person saw your post three times. Reach answers how wide you went. The gap between the two hints at how often the same people are seeing you, which matters for frequency and fatigue.
Engagement rate
This is the single most useful health check you have. It is the share of people who did something (liked, commented, saved, shared) out of the people who saw the post. Because it is a ratio, it lets a small account compare itself fairly against a large one. A rising follower count with a falling engagement rate is one of the clearest early warnings that your growth is getting shallower, and it is worth watching closely.
Saves and shares
These are the quiet heavyweights. A like takes a fraction of a second and means little. A save means someone wanted to come back to your content later. A share means they were willing to put their own name behind it in front of their friends. Platforms know this, which is why saves and shares tend to push content further than likes ever will.
Profile visits and follower conversion
Profile visits tell you how many people were curious enough to tap your name after seeing a post. The follow conversion rate, meaning new follows divided by profile visits, tells you whether your profile actually convinces those curious visitors to stay. A flood of visits with few follows usually means your bio, pinned content, or feed is not closing the deal.
Link clicks and conversions
If you sell anything, run a newsletter, or drive traffic to a site, these are the numbers that touch revenue. Link clicks measure intent. Conversions measure the follow-through: purchases, sign-ups, downloads. Everything upstream, all the reach and engagement, exists to feed this final step.
Watch time and retention
For video and short-form content, how long people stay is worth more than how many showed up. Retention shows you the exact moment viewers start dropping off, which is something no follower count could ever reveal. We will look at a retention curve shortly.
The metrics at a glance
Keep this table nearby. It sums up what each number means, what it is good for, and how often it is worth checking.
| Metric | What it tells you | Best used for | Check it |
|---|---|---|---|
| Reach | Unique people who saw you | Judging content spread | Weekly |
| Impressions | Total times shown | Spotting overexposure | Weekly |
| Engagement rate | Share of viewers who acted | Overall content health | Weekly |
| Saves | People keeping it for later | Finding your best value posts | Per post |
| Shares | People passing it on | Reach potential | Per post |
| Profile visits | Curiosity after a post | Testing hooks | Weekly |
| Follow conversion | Visitors who stayed | Profile and bio quality | Monthly |
| Link clicks | Intent to act | Funnel top | Per campaign |
| Conversions | Real outcomes | Return on effort | Per campaign |
What Good Looks Like: Benchmarks Without the Fear
The most common question is simple. Is my number any good? The honest answer is that it depends heavily on the platform, your niche, and your audience size. Still, rough benchmarks help you know whether you are in a reasonable range or well off it. Treat the figures below as guide rails, not report cards.
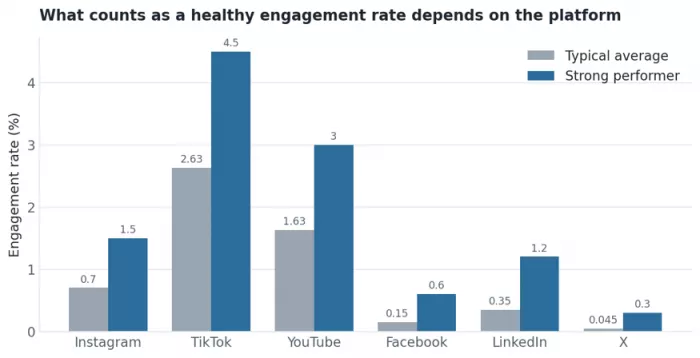
Figure 2. Typical average engagement rates against what a strong performer tends to hit, by platform.
Two things stand out. First, an engagement rate that would be excellent on Facebook would be poor on TikTok, so never compare across platforms. Second, smaller accounts usually post higher engagement rates than large ones, because a tight, interested audience reacts more than a broad, passive one. If your rate slips as you grow, that is normal up to a point. If it falls off a cliff, something in your content or your audience quality needs attention.
| Audience size | Rough engagement rate to expect | What it usually signals |
|---|---|---|
| Under 5,000 | 5% to 8% | Tight, loyal, early audience |
| 5,000 to 20,000 | 2.5% to 5% | Healthy growth stage |
| 20,000 to 100,000 | 1.5% to 3% | Broadening reach, normal dilution |
| Over 100,000 | 1% to 2% | Scale trade-off, watch quality |
Reading Trends, Not Snapshots
A single day's numbers tell you almost nothing. Content has good days and bad days for reasons that have nothing to do with you, from the time you posted to what else was happening in the world. The signal lives in the trend line over weeks, not in yesterday's spike.
Here is a pattern that catches a lot of creators off guard. Followers keep climbing month after month, which feels like a clear win, while engagement quietly drifts the other way. Looked at together, the story is that the account is attracting people who are not that interested, and the content is reaching a smaller and smaller share of them.
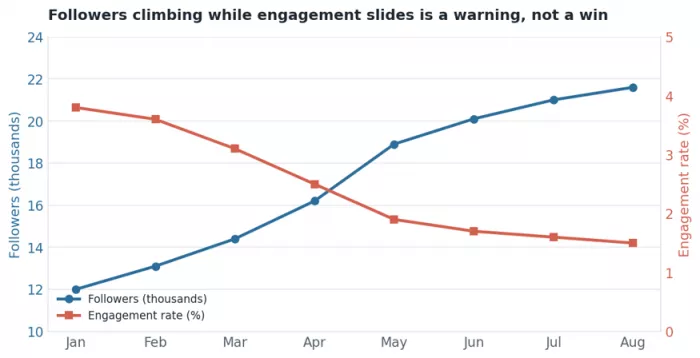
Figure 3. Two lines that tell opposite stories. The follower line alone would have you celebrating.
This is exactly why you never read one metric in isolation. If Deepak had only watched the follower count in this example, everything would have looked healthy. Pairing it with engagement reveals that the growth was hollow, and that the content strategy that worked in January had stopped connecting by summer.
Rule of thumb Always read at least one growth metric and one quality metric side by side. Growth without quality is an audience you are slowly losing. Quality without growth is a great show with an empty room. |
The Funnel: Where a Big Number Quietly Shrinks
Most of your metrics are really stages in one journey. A lot of people see you, fewer are actually reached, fewer visit your profile, fewer click a link, and a small share do the thing you hoped for. Laying them out as a funnel shows you where people fall away, and that is where your next improvement lives.
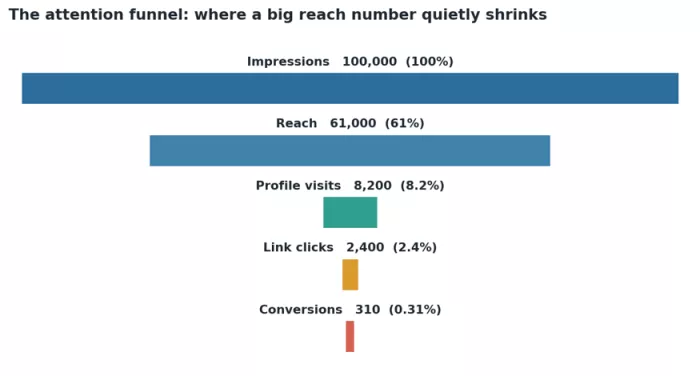
Figure 4. A sample funnel from one hundred thousand impressions down to three hundred conversions.
The value of this view is that it points to the leak. If a huge number of people reach your content but almost none visit your profile, your hooks are working but your content is not making anyone curious about you. If plenty visit but few click, your offer or your call to action is weak. Each stage is a different problem with a different fix, and the funnel tells you which one you actually have.
| Funnel stage | Sample number | Drop from previous | If this stage is weak, look at |
|---|---|---|---|
| Impressions | 100,000 | - | Posting frequency and timing |
| Reach | 61,000 | 39% | Content format and hooks |
| Profile visits | 8,200 | 87% | Whether posts spark curiosity |
| Link clicks | 2,400 | 71% | Your call to action and bio link |
| Conversions | 310 | 87% | Landing page and offer |
Retention: The Metric Follower Count Can Never Give You
If you make any kind of video, the retention curve is close to the most honest feedback you will ever get. It shows the percentage of viewers still watching at each second. Where the line drops, people left. Where it holds flat, you had them.
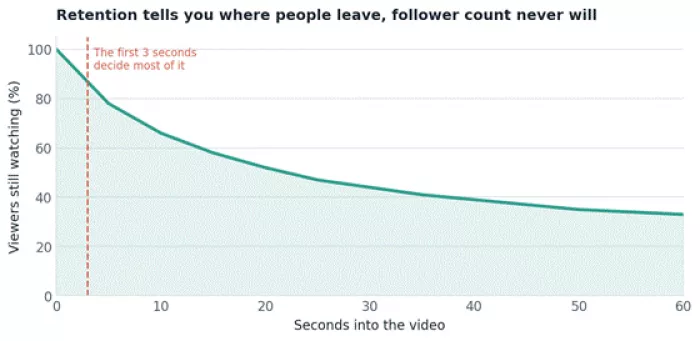
Figure 5. A typical short-form retention curve. The steepest fall almost always happens in the opening seconds.
Notice how much of the audience is gone within the first few seconds. That opening is where most videos are won or lost, and no amount of followers will save a weak hook. When you study your own curves, look for two things. The first is the initial drop, which tells you whether your hook is holding. The second is any sudden cliff partway through, which usually marks the exact moment your content got boring or made a promise it did not keep.
How to Actually Use This: A Weekly Routine
Knowing what the numbers mean is only half the job. The other half is checking them on a rhythm that is frequent enough to catch problems and rare enough that you are not reacting to noise. Here is a simple routine that works for most creators and small brands.
Every week, in about fifteen minutes
Look at engagement rate first. Is it holding steady, rising, or falling over the last four weeks? This is your single best health signal.
Find your top two posts by saves and shares. These are your real winners. Ask what they had in common and do more of it.
Find your weakest post. Do not just note that it flopped. Look at where it lost people, whether in reach, in the hook, or in the click.
Check profile visits against new follows. If visits are high but follows are not, spend time on your bio and pinned content.
Every month, in about thirty minutes
Compare this month to the last two. Trends only show up at this distance.
Walk your full funnel from reach to conversions and find the single biggest leak.
Pick one metric to improve next month. Just one. Focus beats a scattered effort every time.
Set a target, then leave it alone Pick one number to move and one time to check it. Watching the same metric five times a day does not make it grow, it just makes you anxious and tempted to change course before your last change has had time to work. |
Common Mistakes When Reading Analytics
Chasing followers above everything. A big audience that does not engage is a liability dressed as a trophy.
Reacting to a single day. One quiet day is weather, not climate. Wait for the trend before you change anything.
Comparing across platforms. A 1% rate can be excellent on one platform and mediocre on another. Compare yourself only to yourself.
Ignoring saves and shares. They are less visible than likes but far more meaningful for reach and value.
Measuring everything and deciding nothing. If a number never changes your plan, it does not deserve a place in your weekly check.
The Short Version
Your dashboard is not trying to overwhelm you, even though it often does. Most of those numbers are supporting cast. A handful actually direct the show. Watch engagement rate to judge health, saves and shares to find your best work, profile visits and follow conversion to test how convincing you are, and clicks and conversions to connect all of it to something real.
Read trends rather than snapshots, always pair a growth number with a quality number, and let the funnel show you where people fall away. Do that consistently and your analytics stop being a source of stress and start being what they were meant to be, which is a map of what to do next.
Pick one metric this week. Move it next week. That is the whole game.
Benchmark ranges in this guide are typical industry figures and will vary by niche, audience, and season. Use them as guide rails, and let your own trend lines be the final word.



Comments